Profiling Hibernate JPA Queries with MiniProfiler
The rule of software entropy says that software tends to evolve to become more complex. Complexity, often times, has the side effect of performance degradation– more memory is used, execution time slows, and more slow-running SQL queries run. This all happens very gradually over time to the point where software developers don’t really notice until performance degrades to the point of almost unusability (e.g. a request that used to take 100ms now takes 1000ms).
Software entropy (and hence, performance degradation) must be constantly fought against. Actions must be taken to ensure the application remains within an acceptable performance threshold. A great way to do this is to have a visible profiling on the page while developing.
One of the best options for an “always visible on the page” profiler tool is MiniProfiler. It adds a little box in the corner of the page that has page response time, clicking the box shows more detailed profiling data on method execution time and SQL query time. For example:
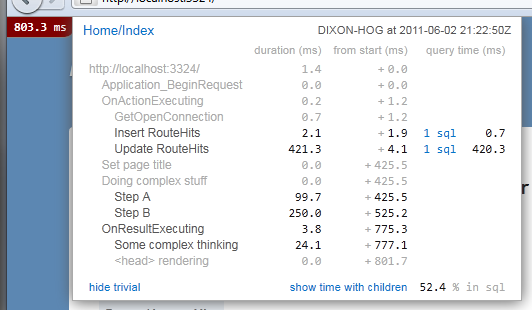
Example courtesy of https://miniprofiler.com/
Unfortunately, MiniProfiler is only available on .NET or Ruby (boo). Fortunately, there is a port for the JVM: https://github.com/tomdcc/miniprofiler-jvm (yeah! thanks, tomdcc). The MiniProfiler JVM docs are pretty straight-forward. It is super easy to profile all EJB and Servlet calls. One thing that is not straight-forward is profiling Hibernate queries. The rest of this post describes how.
Profiling Hibernate Queries
Hibernate has the concept of a Connection Provider, which is basically a java.sql.Connection factory that Hibernate uses to get database connections. We’ll write a custom Connection Provider and wrap the Hibernate data source with the io.jdev.miniprofiler.sql.ProfilingDataSource:
package com.jonbake.hibernate;

import io.jdev.miniprofiler.sql.ProfilingDataSource;

import javax.naming.InitialContext;
import javax.naming.NamingException;
import javax.sql.DataSource;

import org.hibernate.engine.jdbc.connections.internal.DatasourceConnectionProviderImpl;

public class ProfilingConnectionProvider extends DatasourceConnectionProviderImpl {
    public ProfilingConnectionProvider () {
        try {
            // Wrap the normal Hibernate datasource to enable profiling
            setDataSource(new ProfilingDataSource((DataSource) new InitialContext().lookup("java:/datasources/HibernateDS")));
        } catch (NamingException e) {
        }
    }
}
And then update your persistence.xml to use the custom Connection Provider.
<property name="hibernate.connection.provider_class" value="com.jonbake.hibernate.ProfilingConnectionProvider" />
That’s it! Now Hibernate queries will be visible within the profiler.
See a typo? Submit a Pull Request.